Xcode Instruments Performance Profiling and Optimization with Counters
A walkthrough of Counters, an Instruments tool to reliably find performance improvements in apps.

This post walks through Counters, an Instruments tool to profile low-level chip events on Apple devices. With the right configuration, Counters can help you quickly and reliably find performance improvements in apps.
- Profile Apps With Xcode Instruments Counters
- Create Formulas Using Counters
- Profile CPU Branch Misprediction
a. Instructions Per Cycle (IPC) Formula - Profile CPU L2 Cache Misses
- Find iOS Performance Improvements Using Xcode Instruments
Profile Apps With Xcode Instruments Counters
Counters is an Instruments tool used to profile low-level chip events in iOS and macOS apps. For example, the event INST_BRANCH can be added to the Counters tool to count the number of branches executed by the CPU.
Unlike other Instruments tools, Counters requires some configuration to provide valuable insights. Further, the Counters tool profiles events that are hardware-specific. This means the chip event options available on an A10 chip inside of an iPad may be different than the chip events available on an A12 chip inside of an iPhone Xs.
To configure Counters, select File -> Recording Options from the Instruments navigation menu. You'll see a menu show with configuration options for Counters:
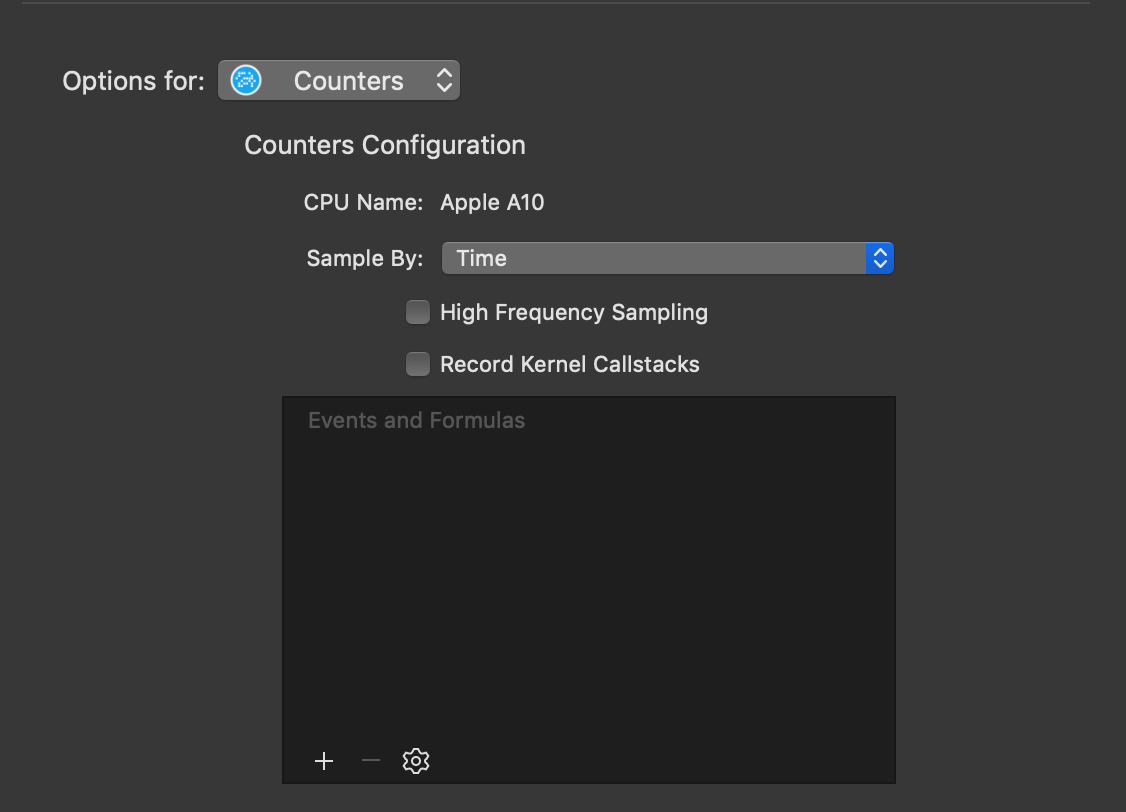
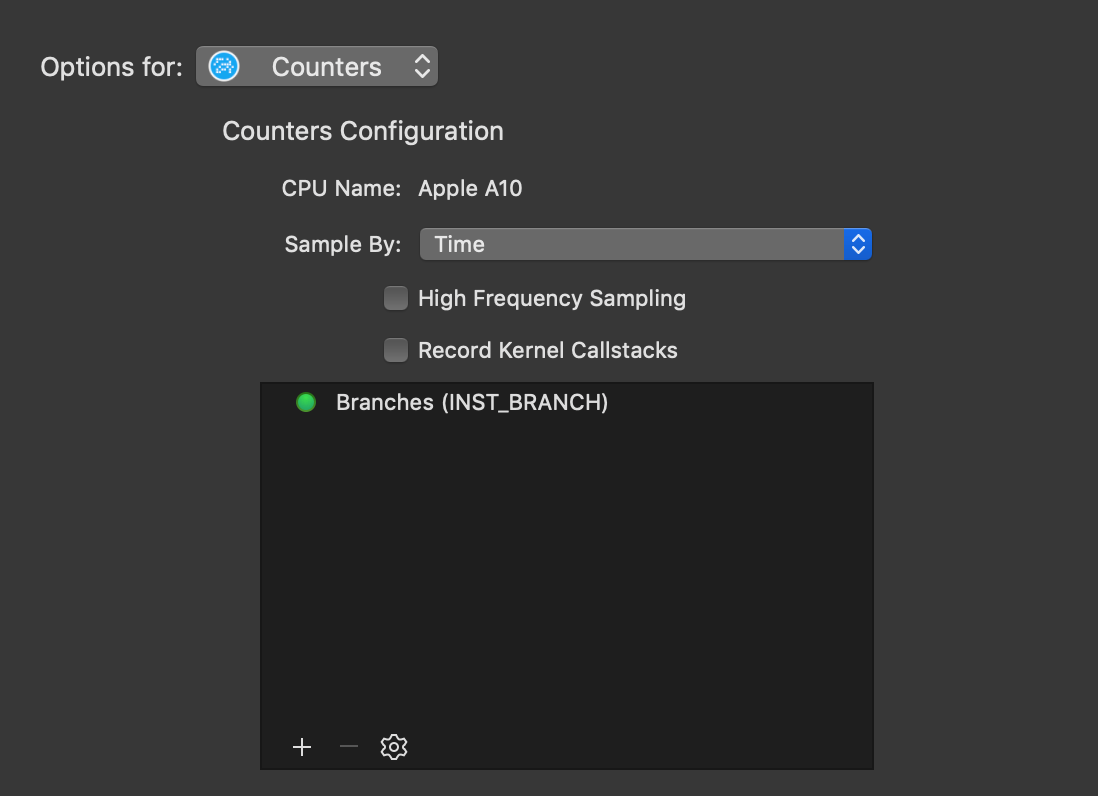
The examples presented in this post will sample by time. Using the + add specific events available on the CPU of the device you connected to Instruments. With INST_BRANCH selected the performance profile may look something like this:
Create Formulas Using Counters
The number of branches executed on the chip is not enough information by itself to find performance issues. Additionally, we need to know the number of missed branches to compute the % of branches missed.
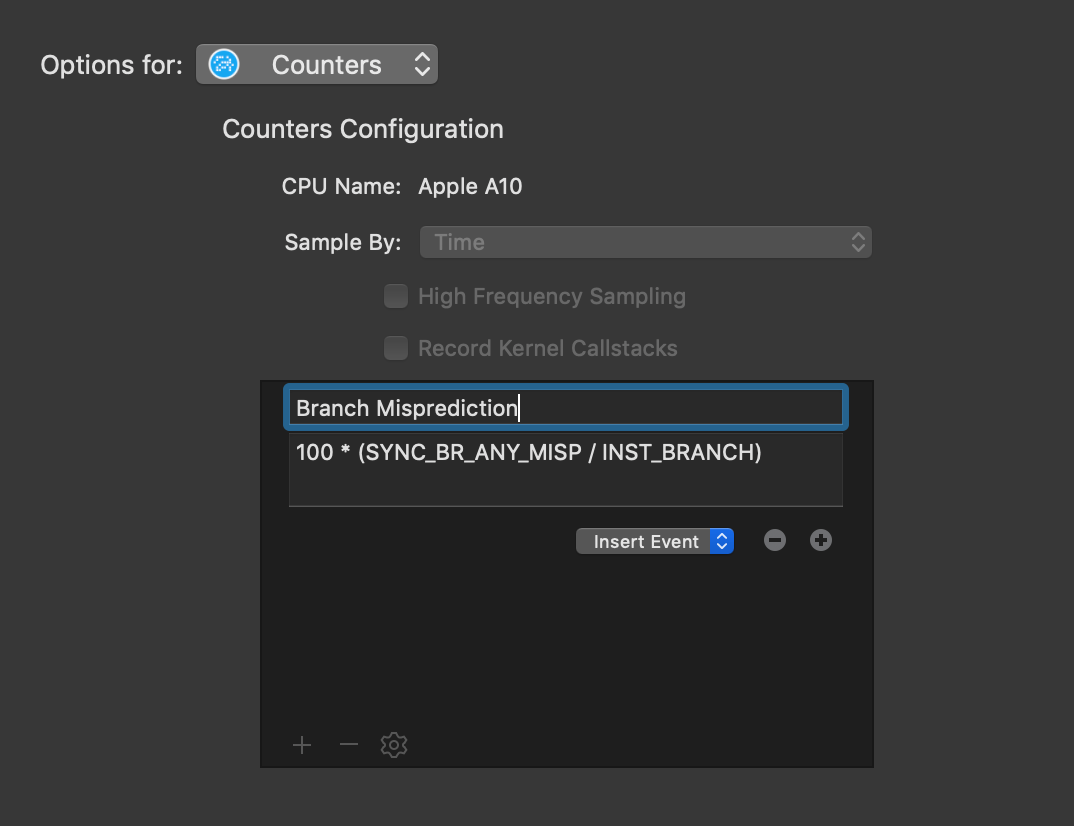
The best way to get high-value performance profiles from Counters is to use formulas. Formulas use events to compute a numerical result, for example, the % of branches missed on the chip. To configure a formula, select the ⚙ icon and then Create Formula.
Profile CPU Branch Misprediction
Branch misprediction is one metric to determine how efficiently code is written. Missed branches by the CPU are expensive and results in slower execution. Reducing the % of branches missed can greatly improve app performance.
To count the % of branches missed, divide the number of missed branches by the total number of branches. Then, multiply by 100. Enter 100 * (SYNC_BR_ANY_MISP / INST_BRANCH) into the Counters formula input:
Instructions Per Cycle (IPC) Formula
Counters can track multiple formulas at once. Instructions per cycle (IPC) is an important metric to determine processing efficiency. The greater the number of instructions per cycle an app executes, the more efficiently the app is using the CPU.
The formula for IPC is the number of instructions divided by the number of cycles. Enter FIXED_INSTRUCTIONS / FIXED_CYCLES into the Counters formula input to create a formula for IPC counting.
Profile CPU L2 Cache Misses
Modern CPUs have multiple levels of caching on the chip, for example, L1, L2, and L3 caches. Counters can only count the events exposed by the chip, and for an A10 chip, only L2 cache events are available. Since the L# caches help the CPU quickly access data, reducing the number of cache misses can greatly increase performance.
The formula for L2 cache misses is the number of missed writes and reads in the L2 cache, divided by the total number of writes and reads. To get the % multiply by 100. Enter 100 * ((L2C_AGENT_ST_MISS + L2C_AGENT_LD_MISS) / (L2C_AGENT_ST + L2C_AGENT_LD)) into the Counters formula input to count cache misses.
Note: the names of the events may be different (or may not exist) on the chip in the device you are profiling.
Find iOS Performance Improvements Using Xcode Instruments
With these three formulas configured, a profile of an iOS or macOS application may look like this:
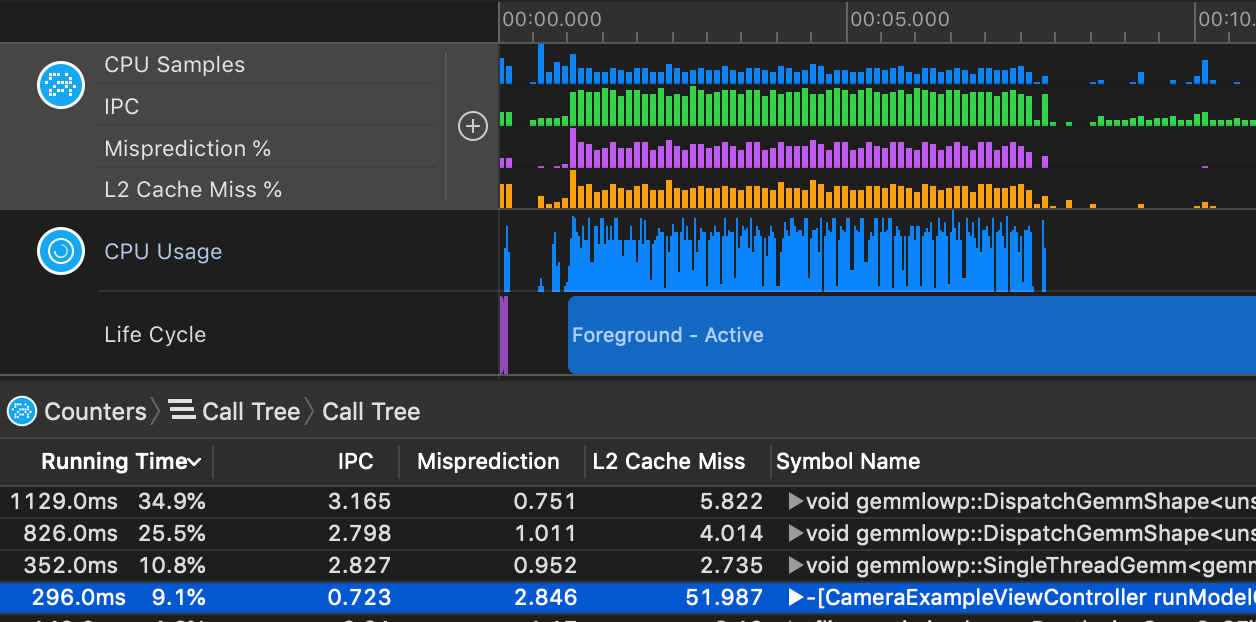
To quickly find performance opportunities, first select Invert Call Tree under the Call Tree menu at the bottom of the Instruments window. This will invert the stack traces collected so Instruments shows root functions first.
Then, sort the list by Running Time and look for the following:
- IPC below 2.5
- Branch Misprediction % greater than 2%
- L2 Cache Misses greater than 5%
These rules are not set in stone and depend on the specifics of your iOS or macOS application. In general IPC, branch misprediction, and cache misses present a baseline guide for finding performance opportunities.
An example of what a great performance opportunity can look like is:
|Time||Time %|IPC|Branch Miss|L2 Cache Miss|Symbol|
|-|-|----|------|---|-------------|---------------|------|
|51.0ms||9.1%|0.723|2.846%|51.987%|-[CameraExample runModelOnFrame:]|
Xcode Performance Profiling and Optimization
That's it! Counters in Xcode make it easy to spot functions and call trees with poor performance characteristics that you can optimize.